Task: Create a simple World map to show the area traversed by the boat in task 14.1. Draw the continental outlines. Put symbols at the 3 cities and draw a line showing the triangular course of the boat.
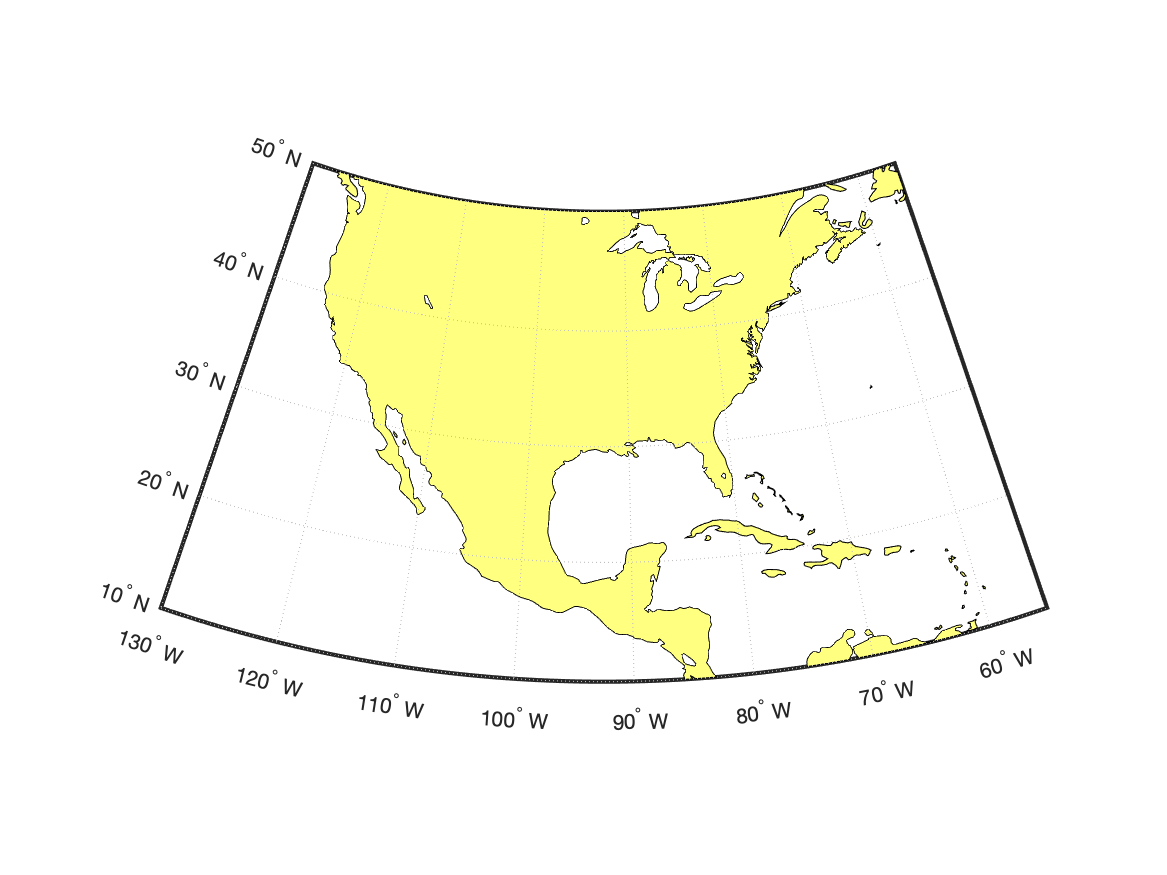
Setting up a map is typically a complicated process requiring decisions about a map projection, controlling latitudes and longitudes and the like. A default map for any location on the World can be created with
worldmap([Latmin Latmax], [Lonmin Lonmax])where the range of latitudes and longitudes are indicated by the pair on numbers as the first and second arguments. The map boundaries are controlled by these latitude and longitude ranges. If the location ranges are not included, the whole world is assumed.

This command simply creates a graphics window and sets up the coordinate conversions from (lat,lon) to (x,y) on the figure
A similar command creates a map for the US
usamap([Latmin Latmax], [Lonmin Lonmax])If location ranges are not included, then the whole continental US is assumed.

The land areas for the map can be added with
geoshow('landareas.shp')
where 'landareas.shp' is a GIS shape file with information about the
location of land (the file is available in MATLAB).
A more general plotting tool is plotm which works just like plot except that it wants locations as lists of latitudes and longitudes which it converts to map locations using the active map projection. One use of this command is the following
 load coast
 plotm(lat,long)
where the load command produces two arrays (lat,long) containing the location of the coastlines. This pair of commands draws continental outlines on the map.
All of the options that you know for the command plot, to control colors, lines styles, marker symbols also work with plotm.
Many of the graphics commands that we have already worked with have a map-aware version that has an "m" appended on the end of the name, similar to plot and plotm. We will see these details shortly.
Flow chart for task
%%%  get locations of cities
%%%  create base world map for these cities
%%%  add coastline to the map
%%%  put symbols and names for cities on map
%%%  draw a line between cities
Script for task.
%%%  get locations of cities
 Loc=[33.7701 -118.1937;34.4437 139.6380 ;-53.1638 -70.9171];
 Name={'Long Beach';'Yokohama';'Punta Arenas'};
%%%  create base world map for these cities
  Latm=-60;LatM=50;Lonm=120;LonM=310;
  figure
   worldmap([Latm LatM],[Lonm LonM])
%%%  add coastline to the map
   geoshow('landareas.shp')
%%%  put symbols for cities on map
   plotm(Loc(:,1),Loc(:,2),'k*')
%%%  draw a line between cities
   hold on
   plotm([Loc(:,1); Loc(1,1)],[Loc(:,2); Loc(1,2)])
   mlabel ON;plabel ON;