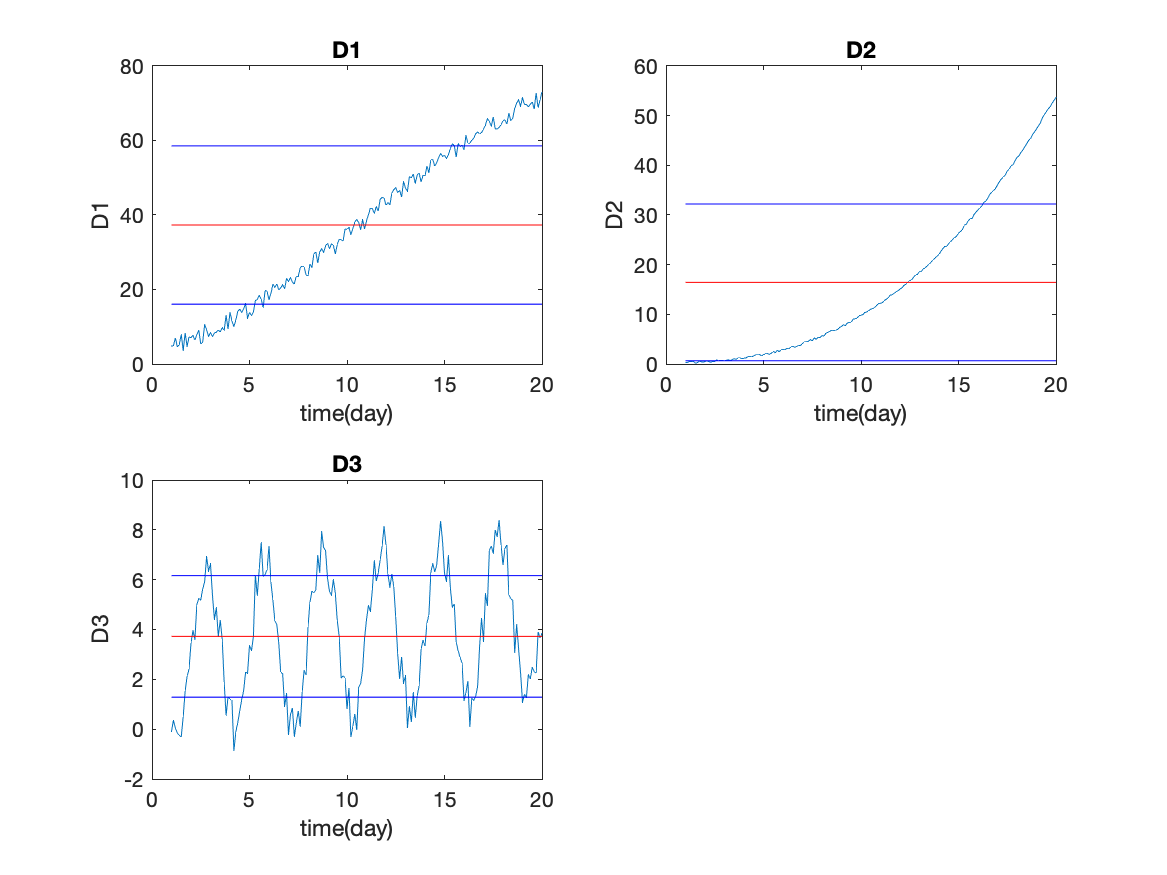
Task: Write a script to read the data file from task 5.1. Leave the data in a matrix. Calculate the mean and variance for all columns. Use subplot to plot each of the three data columns against time. Add a line on each plot showing the mean value. Add two other lines on each plot (in different colors) showing the mean plus and minus the standard deviation. Add appropriate labels and a title.
This task is a minor extension to the first task in this class because the functions (mean, var, std) work on columns, so the command is
  m4=mean(Data);        %  m4 has 4 columns
  m3=mean(Data(:,2:4));  %  m3 has 3 columns
The first command above calculates the mean of all four columns, including the first column (time), which is not useful, but causes no harm. The mean of D1 is in m4(2), and so forth.
The second line in the command above calculates the mean of the second through fourth columns without wasting time calculating the mean of the first column (time). Now the mean of D1 is in m3(1) which is certainly less confusing.
Similar calculations are done by functions var() and std().
It is possible to control the direction of these calculations. Consider that you have a matrix (table) of elevations at uniform distances east (x) and north (y) from a base point. You may be interested in the mean of this data in each direction. That is, at every x (east) location, what is the average of all of the elevations in the northerly direction; and the east-west average elevation for every north (y) location. The function mean can be given a second argument which indicates what direction to work along: 1 means the first dimension (along rows), 2 means the second dimension (along columns).
elevation=load('Elev.dat'); % load the data matrix
[nNorth nEast]=size(elevation); % get number of rows/columns
%          mean along rows, first dimension;
mean1=mean(elevation,1);    % nEast values;
%          mean along columns, second dimension;
mean2=mean(elevation,2);    % nNorth values;
It is also possible to calculate the mean value over an entire table. With a 2D array (DATA), the command TotalMean=mean(mean(DATA)); calculates the mean of all values. The first mean returns the mean of the columns and the second mean returns the mean of the means. A more direct way to do this is TotalMean=mean(DATA,'all');
Almost the same pattern will work with var and std. There is a second argument to these commands which indicates the normalization; whether to divide the variance by N-1 (flag=0) or N (flag=1). A third arguement indicated the direction in the table for the calculation. The command var(DATA,1,2) will calculate the variance across the columns of the array DATA. Finally, the command var(DATA,1,'all') will calculate the variance over all values in the array DATA, dividing by the total number of values in the array. Similarly, the command std(DATA,1,'all') will calculate the standard deviation over all values in the array DATA.
As a final comment, you cannot use a function name as a variable. Well, actually you can, but it is a bad idea. You might try the command
mean=mean(Data);which will run without error. But if you try to use the command again
m2=mean(newData);you will get an odd error "Subscript indices must be real positive integers or logicals". which makes no sense. The first command above has created an array called mean, so the second command is interpreted as trying to refer to members of the array based on indexes in newData, some of which likely have fractional or negative values.
You can undo the damage by typing clear mean which will remove the variable called mean. Now the second command will gain access to the function that you want.
Flow chart for task.
%%%  Task 5.2
%%%  read data
%%%  calculate mean and std from data array
%%%  extract variables for plots
%%%  set up figure and subplots
%%%  for each subplot (indented lines show the block of commands to repeat)
%%%     plot variables (D1,D2,D3)
%%%     add line for mean
%%%     add line for mean +- std
%%%     add labels and title
Here is the script to generate the answer to this task.
%%%  Task 5.2
%%%  read data
  data=load('fitdata.dat');
%%%  calculate mean and std from data array
  mD=mean(data(:,2:4));sD=std(data(:,2:4));
%%%  extract variables for plots
  time=data(:,1);D1=data(:,2);D2=data(:,3);D3=data(:,4);
%%%  set up figure and subplots
  figure
%%%  for each subplot
%%%     plot variables D1
%%%     add line for mean
%%%     add line for mean +- std
   subplot(2,2,1)
    plot(time,D1)
    hold on
    plot([time(1) time(end)],[mD(1) mD(1)],'r')
    plot([time(1) time(end)],[mD(1)-sD(1) mD(1)-sD(1)],'b')
    plot([time(1) time(end)],[mD(1)+sD(1) mD(1)+sD(1)],'b')
    hold off
%%%     add labels and title
    title('D1')
    xlabel('time(day)')
    ylabel('D1')
%%%  for each subplot
%%%     plot variable D2
%%%     add line for mean
%%%     add line for mean +- std
   subplot(2,2,2)
    plot(time,D2)
    hold on
    plot([time(1) time(end)],[mD(2) mD(2)],'r')
    plot([time(1) time(end)],[mD(2)-sD(2) mD(2)-sD(2)],'b')
    plot([time(1) time(end)],[mD(2)+sD(2) mD(2)+sD(2)],'b')
    hold off
%%%     add labels and title
    title('D2')
    xlabel('time (day)')
    ylabel('D2')
%%%  for each subplot
%%%     plot variable D3
%%%     add line for mean
%%%     add line for mean +- std
   subplot(2,2,3)
    plot(time,D3)
    hold on
    plot([time(1) time(end)],[mD(3) mD(3)],'r')
    plot([time(1) time(end)],[mD(3)-sD(3) mD(3)-sD(3)],'b')
    plot([time(1) time(end)],[mD(3)+sD(3) mD(3)+sD(3)],'b')
    hold off
%%%     add labels and title
    title('D3')
    xlabel('time (day)')
    ylabel('D3')
