Task: Use the vectors created in the previous task (time, y1, y2) to create a plot with two panels. Plot y1 and y2 separately in each panel. Add appropriate titles and labels to these plots.
It is possible to put several separate plots on a graphics window with subplot(r,c,n). The first two arguments give the number of rows (r) and columns (c) of panels. The last number refers to which panel is the target of the plot commands. For example,
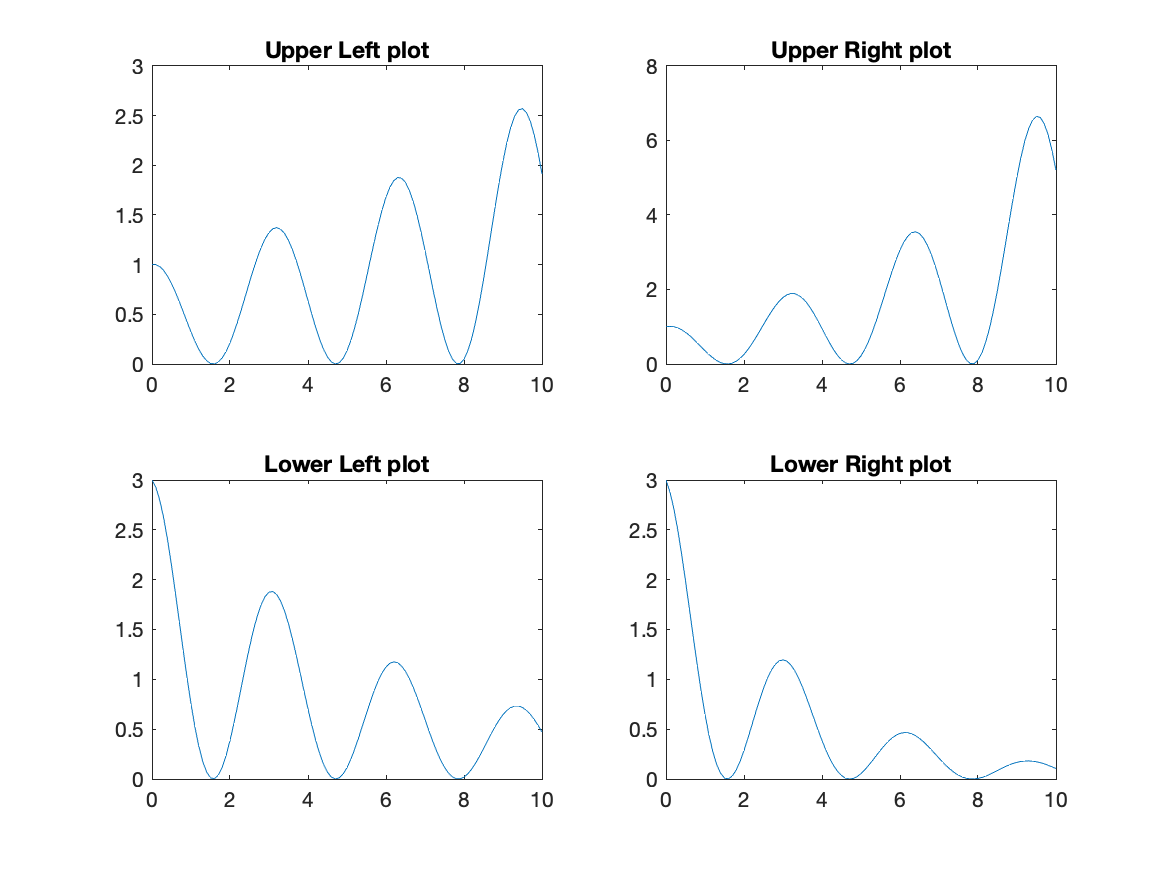
subplot(2,2,1)
plot(x1,y1)
title('Upper Left plot')
subplot(2,2,2)
plot(x2,y2)
title('Upper Right plot')
subplot(2,2,3)
plot(x3,y3)
title('Lower Left plot')
subplot(2,2,4)
plot(x4,y4)
title('Lower Right plot')
creates 4 panels on a graphics window (2 rows, 2 columns) and places a plot
in each panel. The sequential number for the panels starts at the
upper left and counts across the columns, then goes to the next row
counting across the columns (in the same order as we read words in English).
Each panel can be as complicated as you like using all of the graphics commands that have been introduced so far. Note that the save command saves all of the panels to a single file preserving the multi-panel format of the figure.
Script to complete this task:
% task35.m
  time4=0:.1:10;
  y41=exp(.1*time4).*cos(time4).^2;
  y42=3*exp(-.1*time4).*cos(time4).^2;
  figure
  subplot(1,2,1)
   plot(time4,y41,'-r')
   title('Bumpy Func 1')
   xlabel('time')
   ylabel('Funcs')
  subplot(1,2,2)
   plot(time4,y42,'-b')
   title('Bumpy Func 2')
   xlabel('time')
   ylabel('Funcs')