|
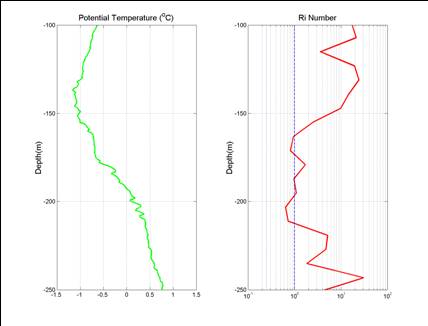
The Ri plot is
shown on the right and the corresponding potential temperature (PT) profile
is on the left. One interesting thing
to us is near 200 m, where the PT profile shows inversions. We think this
might indicate that there is turbulence associated with the large shear and
suggested by the low Ri.
|


