PART 2 FIGURES
To see full-size figures, just click the thumbnails.
- Figure 2.01
- The electromagnetic spectrum.
- (from Microworlds: Exploring the Structure of Materials WWW Site)

-
- Figure 2.02
- Microwave emissivities at each SSMR wavelength for calm open water and first year sea ice.
- (from Cavalieri et al., 1984)

-
- Figure 2.03
- Sources of microwave energy received at the satellite.

-
- Figure 2.04
- The electromagnetic spectrum showing the ultraviolet-to-microwave wavelength range and the atmospheric transmission of various wavelengths (note the "windows," or areas of high transmission, in the visible and microwave regions).

-
- Figure 2.05
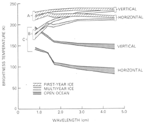
- Microwave brightness temperatures of sea ice and open ocean as observed by the Nimbus-7 SMMR. Hatched bands indicate +/- 1 standard deviation about the mean.
- (from Cavalieri et al., 1984)


