Task: Create a plot of the polynomial y=(x-2).*(x+3).*(x-8) for x in the range [-5 10]. Make the line thick and blue. Draw a second line (thick, dashed and red) along y=0; Add a legend to the plot.
We have already seen that the color, line style and symbols of a line plot can be controlled by passing a third argument to the plot command. The online help from help plot provides information about the many choices for color and line style.
We can also control other aspects of the plot by passing options for line objects. We will see a full range of options when we learn about handle graphics. Some simple options are LineWidth, LineStyle, and Color. These options are controlled by adding the option name (as a string) and the desired value as a pair of arguments to the plot call. The following two plot calls produce the same plot
  plot(x,y,'r--')
  plot(x,y,'Color','r','LineStyle','--');
It is possible to control the width of the line with the following option,
plot(x,y,'r--','LineWidth',2)By default the line width is 0.5.
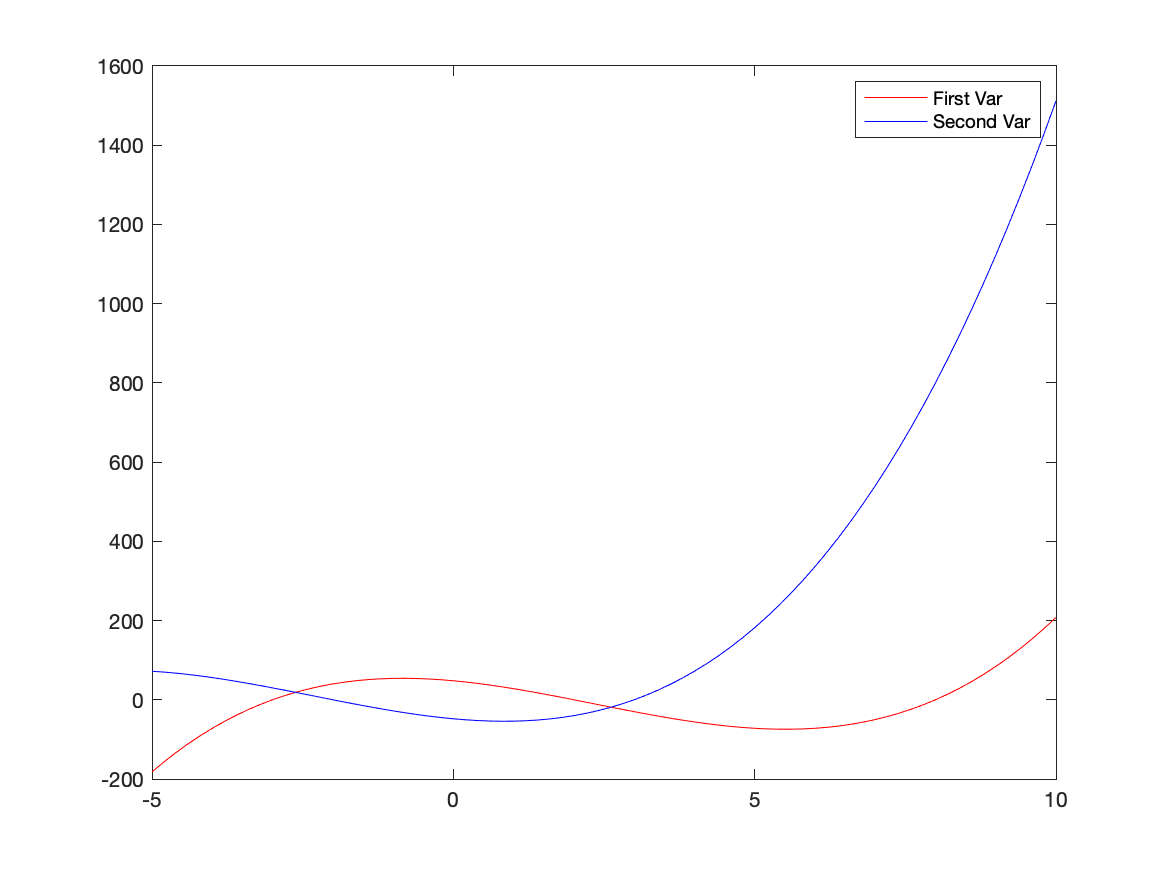
legend puts a box on the plot in a convenient place and identifies the colors and styles of various lines. Consider the following command:
  plot(t,x1,'r',t,x2,'b')
  legend('First Var','Second Var')
which creates a plot with two lines on it (red and blue, respectively, and
a legend). The legend will color the first label red and the second blue.
There can be more strings in the call if there are more lines on the plot.
It is possible to have the label to be enclosed by a box with legend boxon or not with legend boxoff.
You can control the location of the box by adding a Location option as in
  plot(t,x1,'r',t,x2,'b')
  legend('First Var','Second Var','Location','NorthWest')
where the compass directions tell where in the graphics window to put the
label. Appending Outside to the direction moves the label
outside of the plot.
See help legend for more details.
Flow chart for the task:
%%%  create the x array
%%%  evaluate the y array
%%%  plot the line, controlling the line width and color
%%%  plot the line along y=0; control width, style, and color
Solution script for task:
%%%  create the x array
%%%  evaluate the y array
x=[-5:.2:10];y=(x-2).*(x+3).*(x-8);
figure
%%%  plot the line, controlling the line width and color
  plot(x,y,'b-','LineWidth',1.5);
  hold on
%%%  plot the line along y=0; control width, style, and color
   plot(x,zeros(size(x)),'r--','LineWidth',1);
  hold off
  legend('Amplitude','BaseLine')
  title('Blue Function')
  xlabel('Location (km)')
  ylabel('Amplitude')