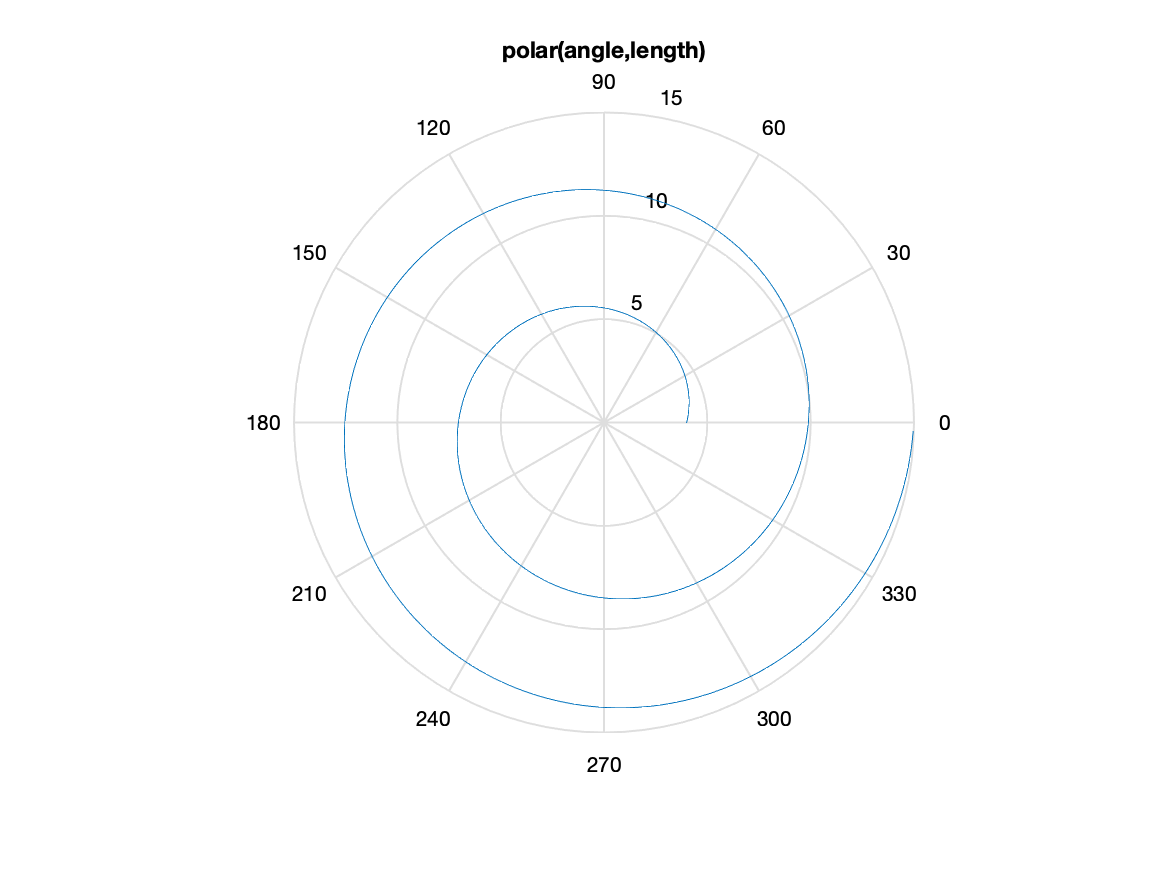
Task: Create 50 wind strengths with W=10*rand(50,1); and create 50 angles with A=pi*randn(50,1) Plot these wind vectors with polar and create a histogram of directions with rose.
Circular plots are often used to display information that is associated with a direction, like winds or currents. In this case, all vectors are plotted from the origin, so information about time is not clearly evident.
A simple plot of a series of lists is obtained with polar(angle,radius). The two input lists must be the same size and shape. The vector angles must be in units of radians. The same result is produced by the command polarplot(angle,radius); however, more options are available with this second command.

The command compass(u,v) is similar to polar, except that the input vectors u,v are components of vectors which are plotted from the origin. Recall from math classes that radius = sqrt(u^2 + v^2) and angle = arctan(v/u), where arctan is the inverse of the tan function.
Finally, the command rose(angles) calculates and plots a histogram of values based on the input collection of angles. Imagine that you have a set of wind directions for some time span. Then, rose will plot the frequency of angles within certain bounds. It is a circular histogram. Once again, angles must be in units of radians,

Note that a circle has angles of 0 to 360 degree and 0 to 2*pi radians. Therefore, pi radians is the same as 180 degrees. If D are a range of angles in degrees then R=pi*D/180; produces the equivalent angles in radians (R). Similarly, for a set of angles in radians, D = 180*R/pi converts the angles to degrees.
In all of these graphics routines, the angles use the math convention (zero angle to the right (along the x axis) with angles increasing counter clockwise). Geographic (compass) directions use zero angle up (along the y axis) with angles increasing clockwise.
How would you convert compass angles in degrees to radian measure in the math convention?
Flow chart for the task:
%%%  create random wind speeds and directions
%%%  create the polar figure
%%%  add a title
%%%  create the wind rose
%%%  add a title
Solution script for the task:
%%%  create random wind speeds and directions
W=10*rand(50,1);
A=pi*randn(50,1);
figure
%%%  create the polar figure
  polar(W,A)
%%%  add a title
  title('Polar display of winds')
figure
%%%  create the wind rose
  rose(A)
%%%  add a title
  title('Wind rose')