Task: Use the global bathymetry from the first task. Calculate the mean and standard deviation of the elevation at every degree of longitude. Plot the mean and the standard deviation of the elevation at every degree of longitude.
Error bars are indicators of the possible spread of values around a mean or other standard value. It might be a standard deviation based on a number of measurements, or it might be the possible precision of a measurement. In either case, it is useful to indicate the variability by showing the value surrounded by a line indicating the possible variation.
If x is a set of locations or times (or experiment numbers), y are the corresponding measurements (or average of replicate measurements) and E is an estimate of the variability of the values of y, then errorbar(x,y,E) will produce a plot of the mean values with lines indicating the variability.

If the error is not symmetric (for example, the value is small and constrained to be positive), then an upper (U) and lower(L) error can be provided with errorbar(x,y,L,U).
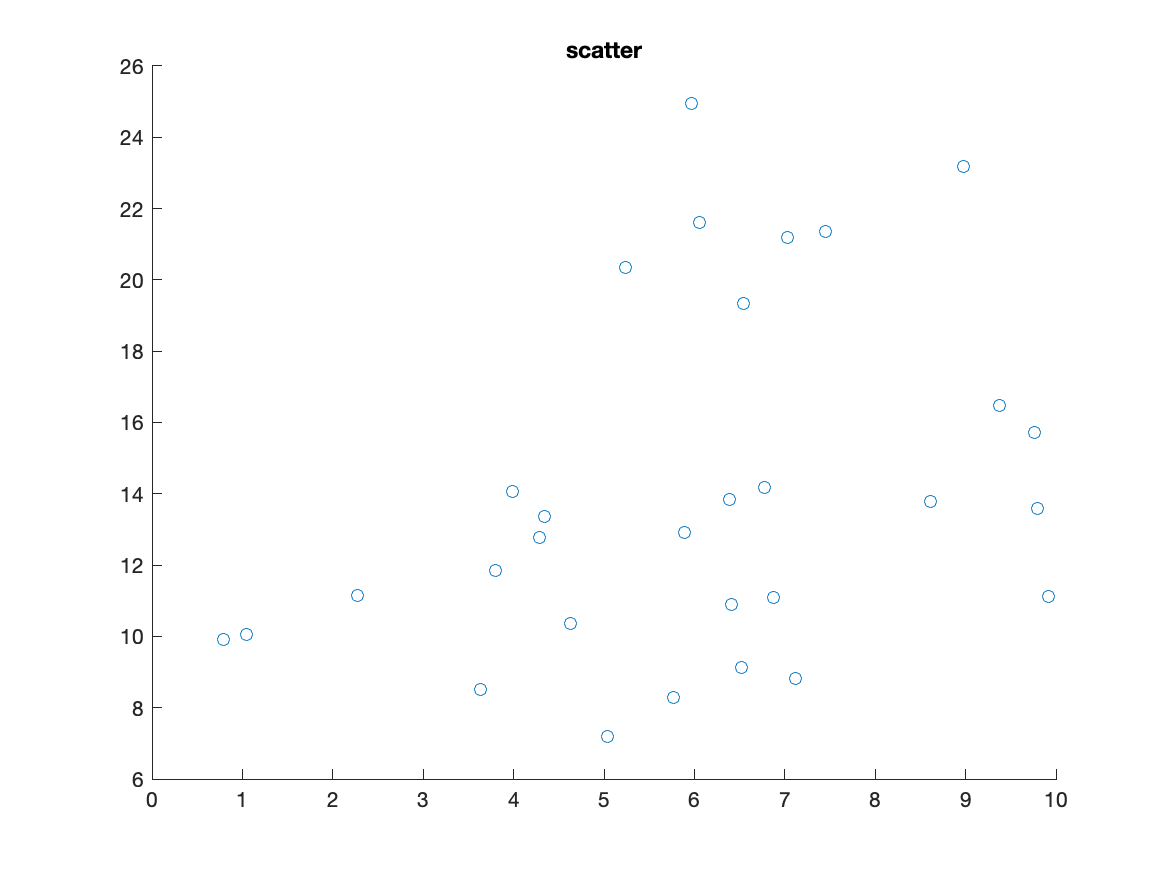
Another way to display observations is as a scatter plot. This might be a property-property plot in which two measurements were made at the same place and time, and some relationship is expected between the two measurements. It might also be a way to show results of a set of replicate measurements for a given experiment.
For two arrays of values of the same length (x and y), a scatter plot is produced with scatter(x,y). This command places a default marker at each of the points.

If there is a third property to display, scatter(x,y,S) will draw a marker at location (x,y) where the marker size is proportional to S. The arrays x,y,S must be the same size and shape. In this case, the plot might be some value (fish catch) at some location, for example (lon,lat). The command would be scatter(lon,lat,fishcatch).
Finally, a fourth property C can be indicated with scatter(x,y,S,C), where the color of the symbols is linearly mapped to the values of C. For example, (x,y) might be a location, and S might be the size of fish catch and C might be the most common fish species in the catch.
An additional character in the function call can indicate the character to be drawn, as in scatter(x,y,S,C,M), where M is a character string indicating the marker to draw. The default is a circle.
A final option, scatter(x,y,S,C,M,'filled'), has the symbol filled with the color instead of just having the symbol outline a given color.
Flow chart for the task:
%%%  calculate the mean
%%%  calculate the standard deviation
%%%  plot the mean
%%%  add a title
%%%  plot the standard deviation
%%%  add a title
%%%  add a label
Solution script for the task:
% calculate statistics along columns (latitudes)
%%%  calculate the mean
  m=mean(GlobalElev);
%%%  calculate the standard deviation
  s=std(GlobalElev);
  figure
    subplot(2,1,1)
%%%  plot the mean
     plot(GlobalLon,m)
%%%  add a title
     title('Mean Depth by Lon')
    subplot(2,1,2)
%%%  plot the standard deviation
     plot(GlobalLon,s)
%%%  add a title
     title('Stdev Depth by Lon')
%%%  add a label
     xlabel('Lon (deg east)')