Task: Create a general setup for figures defining default sizes for lines and fonts. Use these defaults to create a test figure using the arrays created in the first part of this class.
The purpose of these manipulations of figure properties is to produce graphics of consistent quality and style for use in a presentation or for inclusion in a paper. For any given set of figures, it is useful to define all of the relevant values as variables and then use the variables in the commands to create consistent graphics.
Create a matlab script to define all of the properties you want to control. For example,
%   MyFigProps
%      property choices for figures
LW=2;         % Line Width
FS=15;        % Font Size
FW='bold';    % Font Weight
FN='Courier'; % Font Name
which would be put into a file called "MyFigProps.m".
Then at the beginning of the MATLAB session to create graphics, run this script to set the values. Then a set of figures is produced with the following commands:
  MyFigProps   % set the properties (only needs to be done once)
  figure
   Hp=plot(time,Temp);
   Ht=title('Air Temperature');
   Hx=xlabel('time(days)');
   Hy=ylabel('degree C');

   set(gca,'LineWidth',LW);
   set(gca,'FontSize',FS,'FontWeight',FW,'FontName',FN)
   set(Hp,'LineWidth',LW);
   set(Ht,'FontSize',FS,'FontWeight',FW,'FontName',FN)
   set(Hx,'FontSize',FS,'FontWeight',FW,'FontName',FN)
   set(Hy,'FontSize',FS,'FontWeight',FW,'FontName',FN)
Using variables in this way also allows you to change any property only once
in the setup script then all of the figures are created with the
properties that you want.
It is best to change the axis properties as the first change, since this also affects labels and properties. Then, make specific changes if you want something different.
You might want to add other general properties for your plots, such as background color or axis colors and so forth.
Flow chart for script:
%%%  set up script to define figure properties. save it to a file for later use.
%%%  call the script to define figure properties
%%%  Create the plot
%%%  add labels and a title
%%%  modify properties based on the setup script
Solution script for the task:
%%% set up script to define figure properties. save it to a file for later use.
% (script defined below)
%%% call the script to define figure properties
MyFigProps % set the properties (only needs to be done once)
figure
%%% Create the plot saving handles
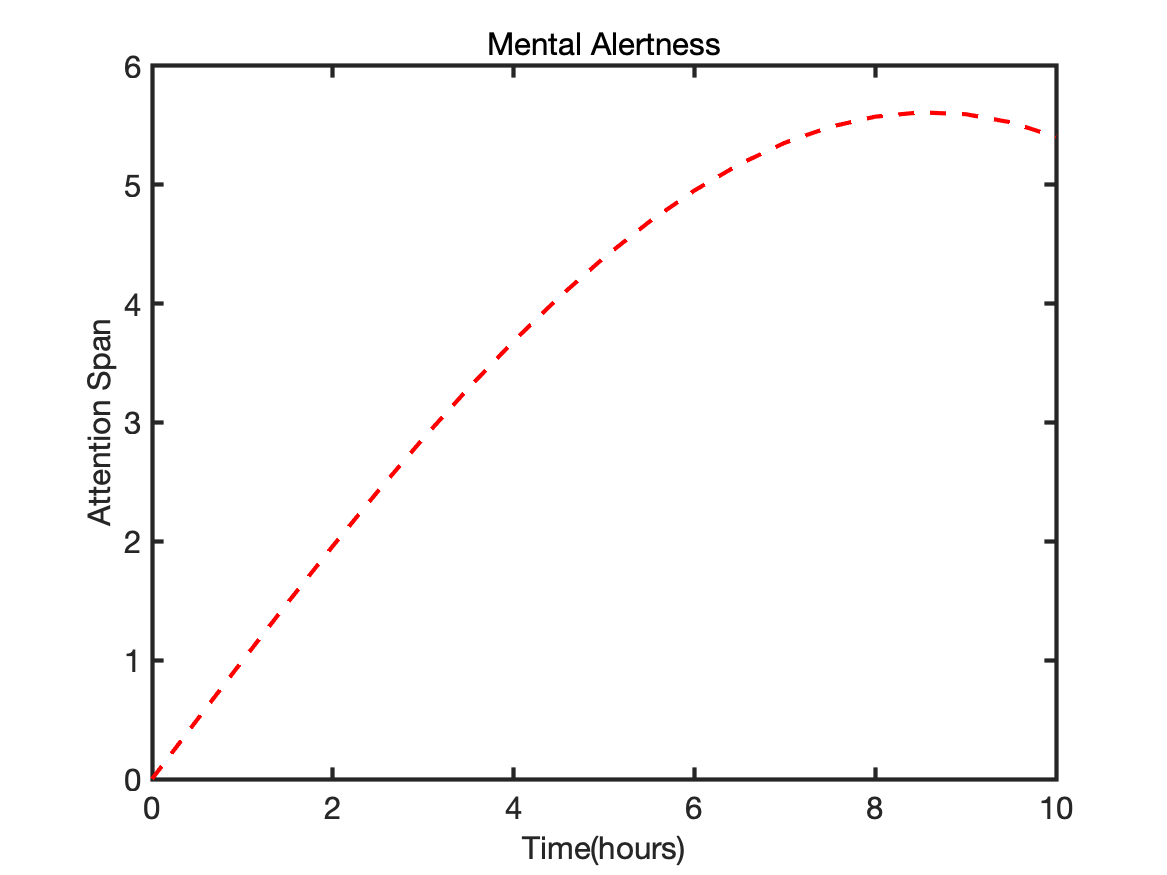
Hp=plot(t,F,'r--');
%%% add labels and a title saving handles
Hx=xlabel('Time(hours)');
Hy=ylabel('Attention Span');
Ht=title('Mental Alertness');
%%% modify properties based on the setup script
set(Hp,'LineWidth',LW);
set(gca,'LineWidth',LW,'FontSize',FS,'FontWeight',FW)
set(Hx,'FontSize',FS,'FontWeight',FW)
set(Hy,'FontSize',FS,'FontWeight',FW)
set(Ht,'FontSize',FS,'FontWeight',FW)
Script to set up figure properties.
%   MyFigProps
%      property choices for figures
LW=2;         % Line Width
FS=15;        % Font Size
FW='bold';    % Font Weight
FN='Courier'; % Font Name