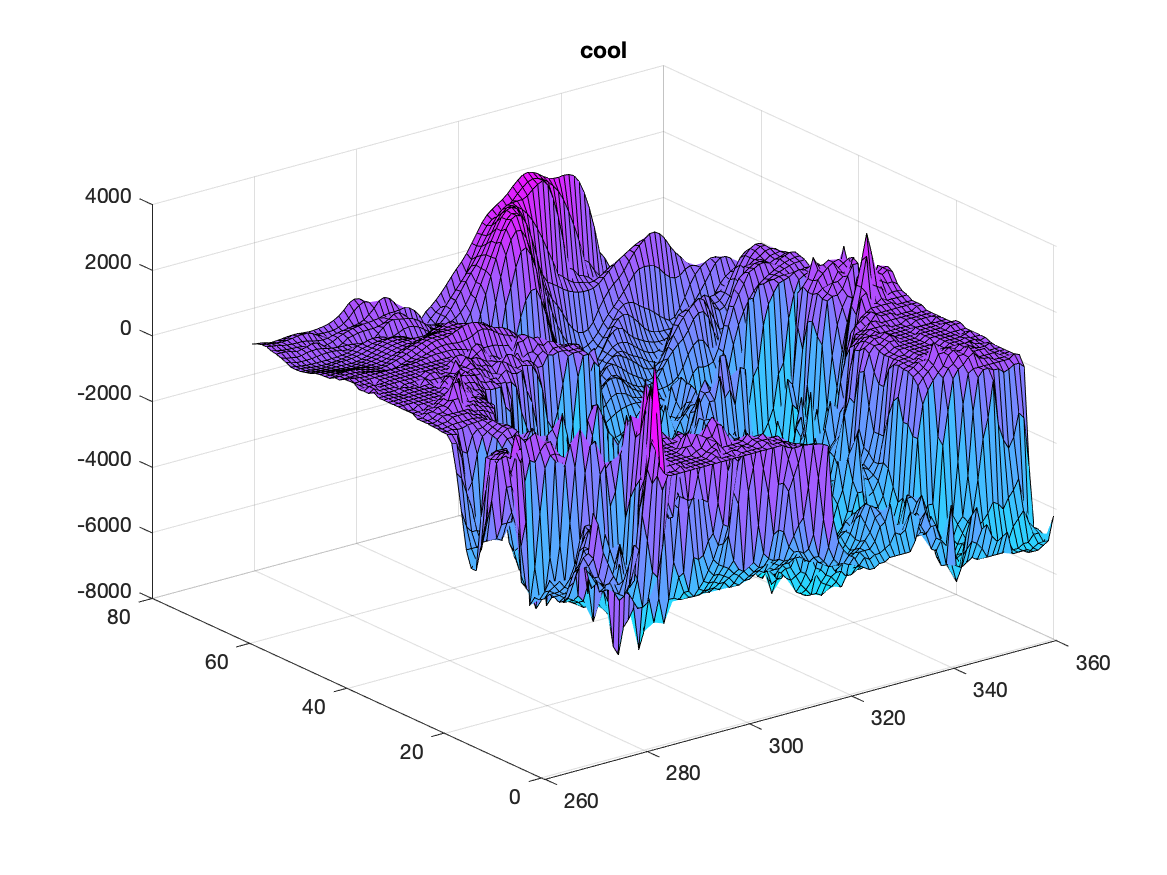
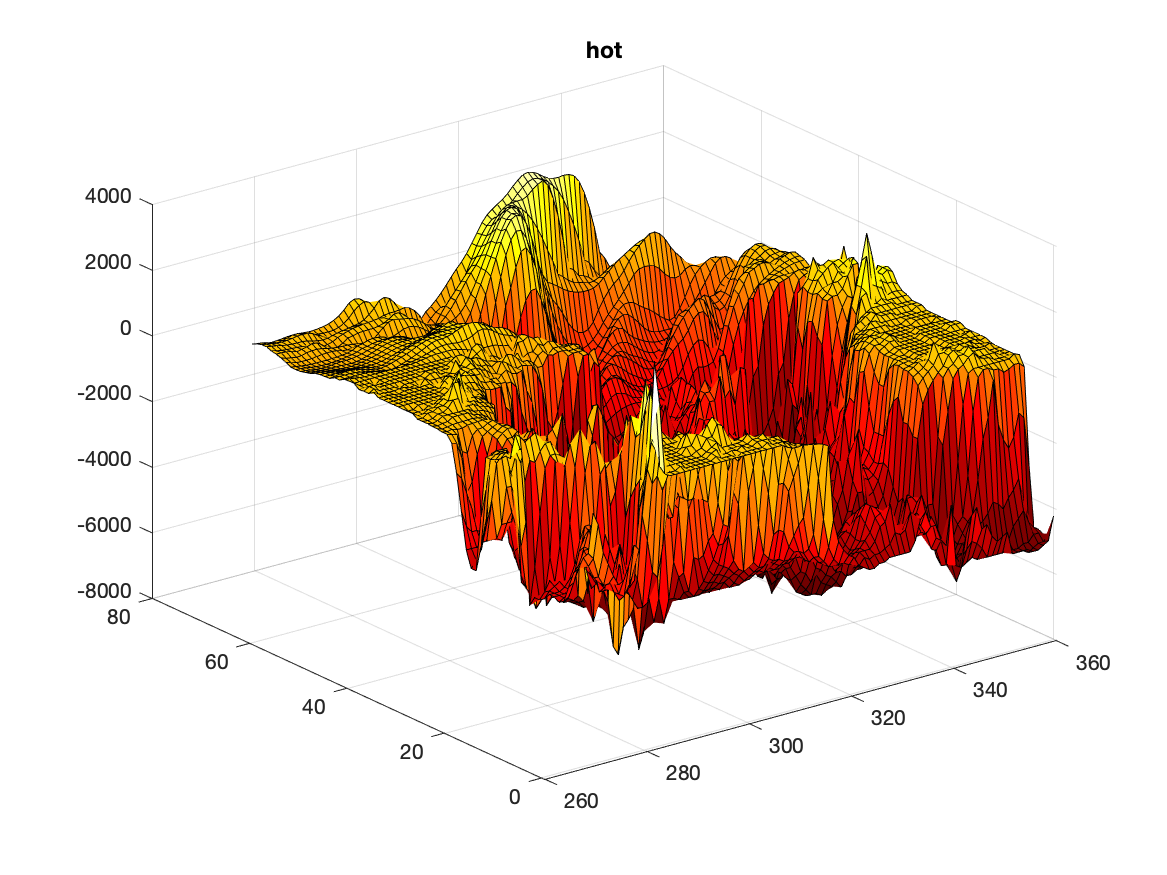
Task: Modify the colormap used to create a surf plot of NAelev in NAbathy.mat. Contrast the appearance of the image using the cool and hot color maps.
Up to now in the class, we have been limited to predefined colors using one letter abbreviations for the names. The multicolor plots have used the same set of colors to show different values on plots produced by contourf and surf. We can control these colors.
The first way to control colors is to use predefined sets of colors which are referred to as colormaps. These are sets of 64 colors that are pleasing or useful (according to MATLAB developers). The default colormap is called jet, which is the distribution of colors produced by white light defracted through a prism. The first colors are dark blue which change to green, yellow, red and then dark red (ROY G BIV, backwards).
A colormap is defined with the command colormap(jet). The variable jet is a pre-defined variable. You can see its RGB values by typing jet.
There are a number of other color maps. See documentation on colormap for a view of the varous colors in these maps. The color maps are named parula, jet, hsv, hot, cool, spring, summer, autumn, winter, gray, bone, copper, pink, lines, colorcube, prism, flag, white. Others might be added in later versions of MATLAB.
You can create your own colors and color maps using the RGB system, which stands for Red, Green, Blue system. It is an additive color system based on the intensity of the three colored lights. A specific color is defined by giving the intensity of each of these lights in a range of zero to one.
For example, [1 0 0] means that the red light is on full and the others are off giving the color red. [1 1 1] has all of the lights full on giving white. [0 0 0] has all of the lights off giving black. The various colors in the colormaps are defined by the brightness of the three fundamental colors.
MATLAB has an interactive colormap editor (called colormapeditor) which can help design colors. There are also online resources to define colors. Be aware that some color systems define the light brightness as 0 to 255 (based on unsigned 8 bit integers) instead of 0 to 1.0. It is clearly easy to convert between the two systems by dividing the larger number system by 255 to get the MATLAB colors.
In any place where color is defined in MATLAB, it is possible to use a color name or a color triplet. So the following command will create a red line on a plot:
   Hp=plot(x,y);
   set(Hp,'Color',[1 0 0]);
%   or
   Hp=plot(x,y,'Color',[1 0 0]);
Solution script for the task:
 load('NAbathy.mat')
 figure
  surf(NAlon,NAlat,NAelev);
  colormap(cool)
  title('cool')
 figure
  surf(NAlon,NAlat,NAelev);
  colormap(hot)
  title('hot')