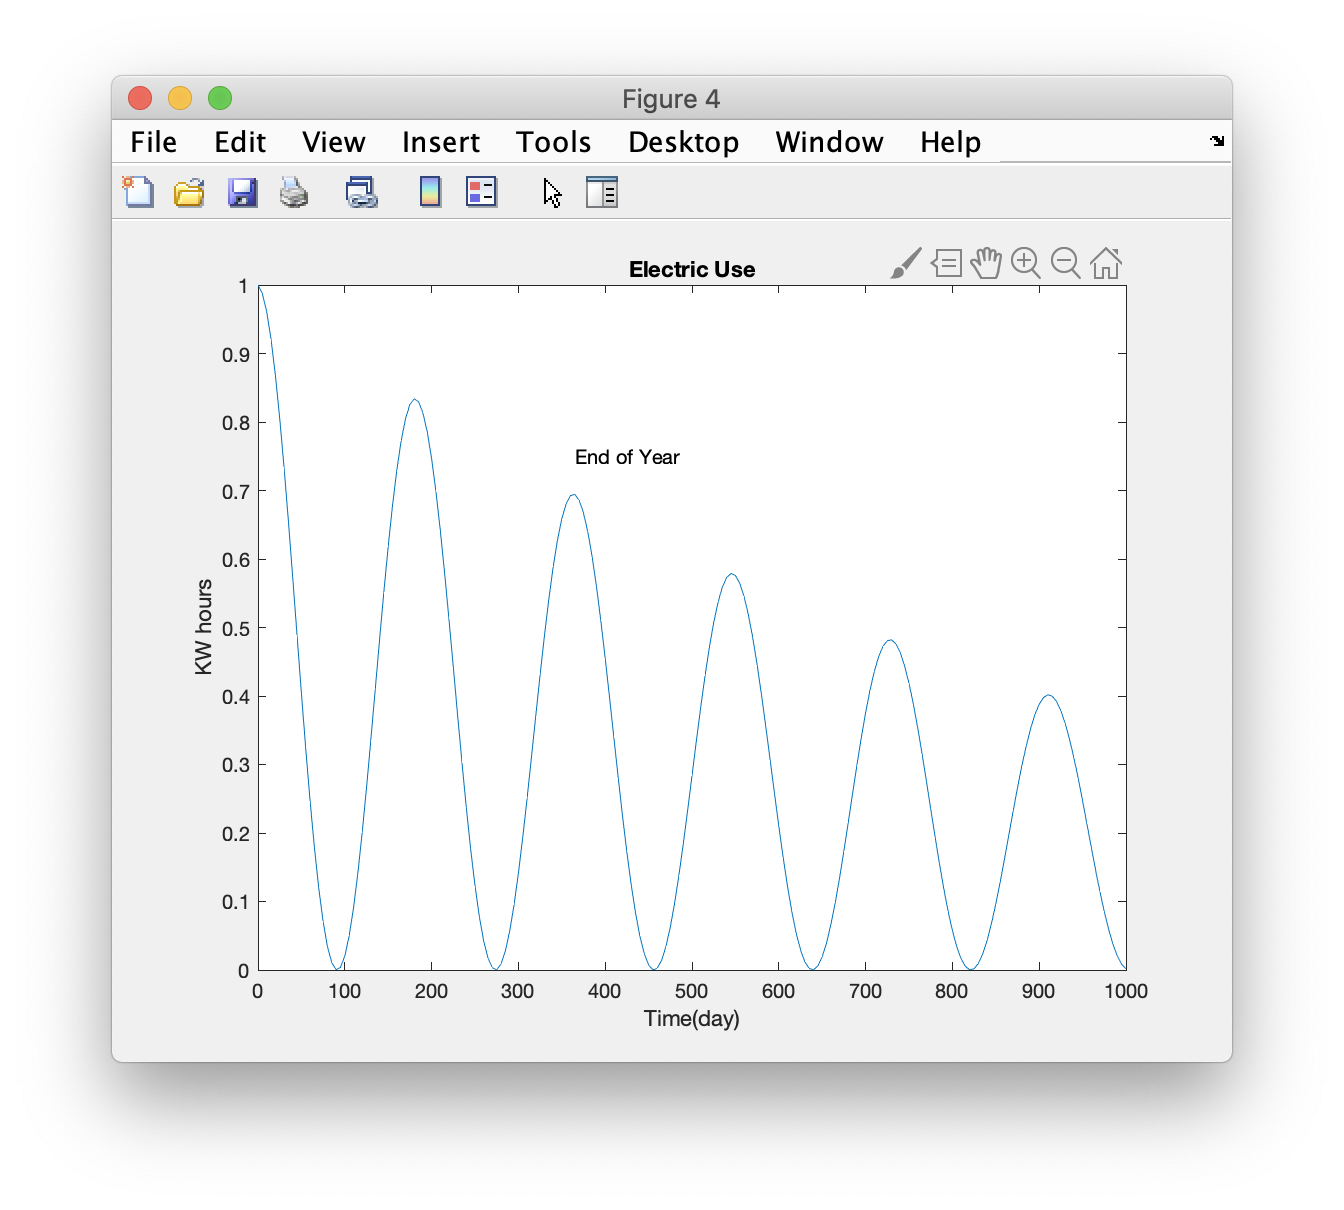
Task: In a script, create a vector, called time, ranging from 0 to 1000 with intervals of 5 (assume units of days). Evaluate y = exp(-.001*time).*cos(2*pi*time/365).^2;. Plot this function with appropriate labels and titles. Save the graph using the PNG format.
The command text(xt,yt,'string') puts the indicated string at the indicted place on a plot. The units for the text location, (xt,yt), are the same as the units for the variables in the plot command.
The location (xt,yt) is the center of the left edge of the string and is relative to the scale (user units) on the plot. The text must be placed inside the axis range of the plot (not where the title and labels are placed). Text outside of the plot range will not show up.
There are several ways to get a copy of a plot. The simple command print will send the plot to the default printer.
An alternative way to print a graph is to use the "file" pull-down menu on the graphics window; at the bottom is the print command. You may want to look at the page preview to make sure that the printed figure will have the correct size and placement. This works for the occasional graph, but is not convenient for routine work.
In many cases, you are creating figures for use in other documents or presentations. In these cases, you need to save the graph to a file which can be imported into the document/presentation that you are creating.
The general command is print('filename','-dtype') where the resulting file will have the indicated name. The file format can be jpeg, tiff, png, postscript (ps), encapsulated postscript (eps), gif among many others. Use help print or doc print to see all of the options.
So, print('Fig1.png','-dpng') will save the current graph with the name Fig1.png in PNG format. Notice that only the figure is saved, not the window border (shown in the screen shot above).
If you use the command without a device specification, print('Fig1.png'), then the figure is sent to the default printer.
If you do not provide a file extension on the file name, MATLAB will add the correct extension. MATLAB will use the file extension that you provide, even if it is not consistent with the image format.
Useful image formats are png and jpeg (.jpg, .jpeg). These are bitmap formats with reasonable sizes and quality. Word and PowerPoint will import images in these formats.
Postscript (and pdf) formats are vector based which avoid pixelation when images are magnified. Images are sometimes converted to bitmap on import to documents (72 dot per inch) which creates poor image quality.
A discussion of image formats and qualities is beyond the scope of this class. It is best to try several options for saving graphs and use the one that works best with your document/presentation software.
Script to complete this task:
  time=0:5:1000;
  y2=exp(-.001*time).*cos(2*pi*time/365).^2;
  figure
  plot(time,y2)
  title('Bumpy Function')
  xlabel('time (day)')
  ylabel('function')
  print('task32.png','-dpng')