Estación Costera de Investigaciones Marinas
Coastal Temperature
Time series of coastal temperature have been obtained from temperature loggers mounted directly on the rock surface of the tidal (1997-2000) and subtidal zone (1-2 meters below the lowest low tide mark, 2000-Now) along the coast of central Chile, covering around 500 km of coastline between 30 and 34° S.
Identification |
Depth |
Moor |
Date |
Sample
|
|
|
Start |
End |
||||
|
Moor1 |
3, 7, 14, 20m |
ECIM |
25/01/1999 |
26/06/1999 |
5 min |
|
Moor12 |
3, 7, 14, 20m |
ECIM |
10/12/1999 |
23/03/2000 |
5
min |
|
Moor34 |
7,
14 y 20m |
ECIM |
21/11/2000 |
27/11/2001 |
5 min |
|
Moor5 |
2, 7, 10, 14, 17, 20m |
ECIM |
27/11/2001 |
04/12/2003 |
5 min |
|
Moor6 |
3,
7, 10 y 20m |
ECIM |
04/12/2003 |
Now |
5
min |
|
Valpo |
11,
15, 17, 25, 90m |
VALPO |
30/11/2000 |
11/03/2001 |
60 min |
|
MoorQ |
3, 9, 15m |
Quisco |
|
|
5
min |
NOTE: Moor1, Moor12, Moor34, Moor5 and Moor 6 are located in the same position only have changed the depth of the temperature sensors.
Site |
Latitude
(°S)
|
Longitud
|
Date |
Sample
Interval |
|
|
Start |
End |
||||
|
El
Temblador |
29°
28’ 19.3’’ |
71°
18’ 50.1’’ |
18/01/1999 |
Now |
20
min |
|
El
Arrayan |
29°
41’ 34.0’’ |
71°
19’ 20.9’’ |
01/09/1997 |
Now |
20
min |
|
Guanaqueros |
30°
12’ 00.8’’ |
71°
28’ 48.0’’ |
16/01/1998 |
Now |
20
min |
|
Punta
Talca |
30°
55’ 47.1’’ |
71°
40’ 49.1’’ |
24/01/1999 |
Now |
20
min |
|
Los
Molles |
32°
14’ 36.1’’ |
71°
30’ 54.6’’ |
18/01/1999 |
Now |
20
min |
|
Montemar |
32°
57’ 27.4’’ |
71°
32’ 59.1’’ |
13/03/2002 |
Now |
5
min |
|
Punta
Curaumilla |
33°
06’ 05.9’’ |
71°
44’ 02.7’’ |
16/12/1997 |
Now |
5
min |
|
Quintay |
33°
11’ 33.0’’ |
71° 42’
15.5’’ |
24/04/1998 |
Now |
5
min |
|
Tunquen |
33°
17’ 53.7’’ |
71°
39’ 19.6’’ |
11/09/2002 |
20/01/2003 |
5
min |
|
El
Quisco |
33°
23’ 35.7’’ |
71° 42’
11.3’’ |
08/08/1998 |
Now |
5
min |
|
Punta
Tralca Norte |
33°25’ 21.6’’ |
71° 42’
03.2’’ |
13/09/2002 |
20/01/2003 |
5
min |
|
Punta
Tralca Sur |
33°25’ 38.8’’ |
71° 42’
20.5’’ |
21/08/2002 |
20/01/2003 |
5
min |
|
El
Tabo |
33°
27’ 01.8’’ |
71°
40’ 39.8’’ |
20/07/2002 |
20/01/2003 |
5
min |
|
Las
Salinas |
33°
29’ 39.8’’ |
71°
38’ 33.7’’ |
20/07/2002 |
11/09/2003 |
5
min |
|
ECIM |
33°
30’ 07.4’’ |
71°
38’ 01.8’’ |
20/07/1997 |
Now |
5
min |
|
Playa
Chica LC |
33°
30’ 05.9’’ |
71°
37’ 23.9’’ |
20/07/2002 |
20/01/2003 |
5
min |
|
Cartagena |
33°
33’ 00.8’’ |
71°
36’ 44.3’’ |
02/08/2002 |
20/01/2003 |
5
min |
|
Pelancura |
33° 33’
07.9’’ |
71°
37’ 27.0’’ |
21/02/2001 |
20/01/2003 |
5
min |
|
San
Antonio |
33°
35’ 38.7’’ |
71°
37’ 22.1’’ |
21/02/2001 |
20/01/2003 |
5
min |
|
Santo
Domingo |
33°
45’ 55.6’’ |
71°
38’ 09.0’’ |
21/02/2001 |
20/01/2003 |
5
min |
|
Punta
Toro |
33°
45’ 55.6’’ |
71°
46’ 21.6’’ |
20/07/2002 |
20/01/2003 |
5
min |
|
Matanza |
33°
57’ 44.3’’ |
71°
52’ 37.7’’ |
06/09/1997 |
Now |
5 min |
|
Pichilemu |
34° 25’ 38.6’’ |
71°
02’ 58.1’’ |
05/09/1997 |
Now |
5
min |
Time series of moored temperature have been obtained from moorings deployed in the inner shelf off El Quisco and Las Cruces.
Currentmeter |
Depth |
Moor |
Date |
Sample Interval |
|
|
Start |
End |
||||
|
Sensordata |
3 and 20m |
ECIM |
11/12/1999 |
21/12/1999 |
5 min |
|
Sensordata |
3 and 20m |
ECIM |
08/01/2000 |
18/01/2000 |
5 min |
|
Sensordata |
3 and 20m |
ECIM |
03/04/2000 |
19/04/2000 |
5 min |
|
Sensordata |
7 and 20m |
ECIM |
21/11/2000 |
03/12/2000 |
60 min |
|
Sensordata |
7m |
ECIM |
25/01/2001 |
08/03/2001 |
60 min |
|
Sensordata |
12m |
ECIM |
01/06/2001 |
24/01/2002 |
60 min |
|
Sensordata |
12 and 20m |
ECIM |
06/02/2002 |
16/04/2002 |
60 min |
|
Sensordata |
12m |
ECIM |
07/05/2002 |
06/01/2003 |
60 min |
|
Sensordata |
12m |
VALPO |
10/01/2002 |
01/03/2002 |
60 min |
|
ADCP |
5-31m (e/1m) |
ADCP |
26/11/2002 |
06/01/2003 |
60 min |
|
ADCP |
5-31m (e/1m) |
ADCP |
22/02/2003 |
19/06/2003 |
10 min |
|
RCM9 |
70m |
VALPO |
30/11/2000 |
11/03/2001 |
30 min |
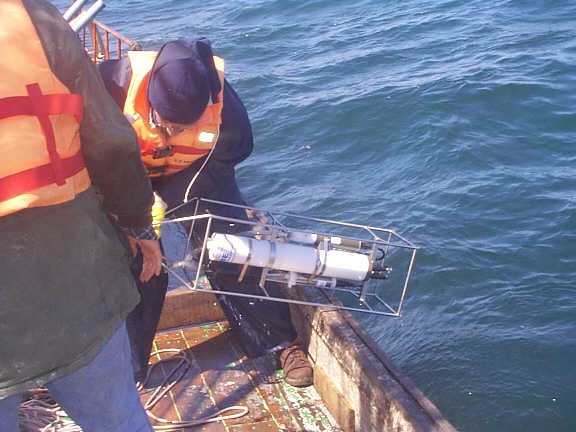
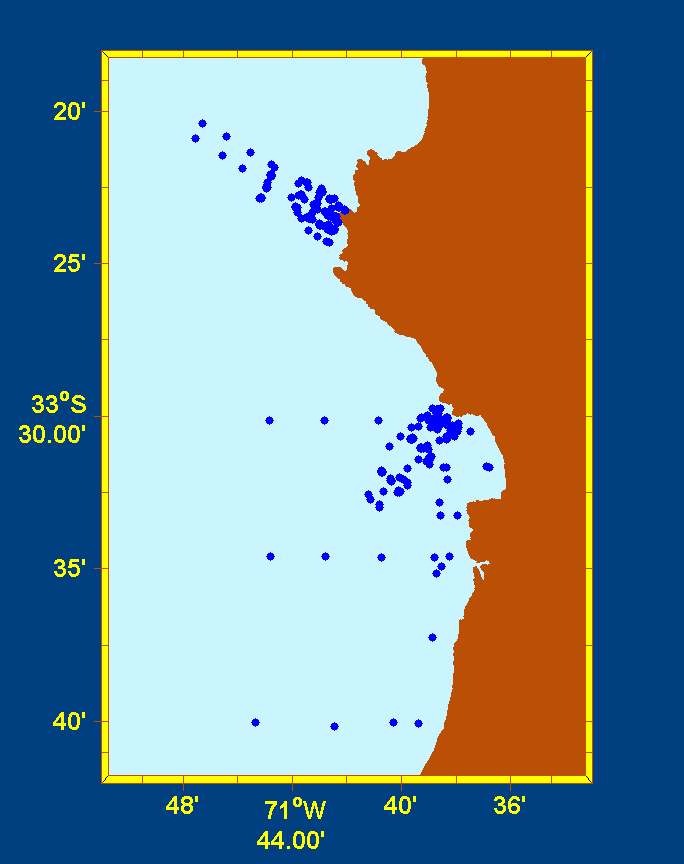
CTD cast have been carried out mainly off Las Cruces and El Quisco (see figure bellow), between 0 and 30m. Data of temperature, salinity, fluorescence and oxygen have been obtained with a SBE 19, both fluorescence and oxygen have been calibrated by in situ water samples (for more details see Narváez et al 2004). The following table show in detail the date and location of each cruise.
|
Starting date |
Ending date |
CTD Model |
|
|
|
|
|
26/Feb/02 |
06/Mar/02 |
2745 |
|
06/Mar/02 |
19/Mar/02 |
2745 |
|
19/Mar/02 |
11/Abr/02 |
2745 |
|
11/Abr/02 |
01/May/02 |
2745 |
|
01/May/02 |
16/May/02 |
2745 |
|
16/May/02 |
30/May/02 |
2745 |
|
30/May/02 |
15/Jul/02 |
2745 |
|
15/Jul/02 |
05/Ago/02 |
2745 |
|
05/Ago/02 |
12/Ago/02 |
2745 |
|
01/Nov/02 |
14/Nov/02 |
2745 |
|
14/Nov/02 |
22/Nov/02 |
2745 |
|
22/Nov/02 |
14/Dic/02 |
2745 |
|
14/Dic/02 |
26/Dic/02 |
2745 |
|
26/Dic/02 |
13/Ene/03 |
2745 |
|
13/Ene/03 |
28/Ene/03 |
2745 |
|
No |
Research Name |
Date |
Area |
|
|
|
|
|
|
1 |
PUC |
20/07/1999 - 21/07/1999 |
Las Cruces - El Quisco |
|
2 |
PUC |
28/08/1999 |
Las Cruces |
|
3 |
PUC |
23/09/1999 - 24/09/1999 |
Las Cruces - El Quisco |
|
4 |
PUC |
14/10/1999 - 15/10/1999 |
Las Cruces - El Quisco |
|
5 |
PUC |
27/11/1999 - 28/11/1999 |
Las Cruces - El Quisco |
|
6 |
PUC |
21/12/1999 - 22/12/1999 |
Las Cruces - El Quisco |
|
7 |
PUC |
18/01/2000 - 19/01/2000 |
Las Cruces - El Quisco |
|
8 |
PUC |
24/02/2000 - 25/02/2000 |
Las Cruces - El Quisco |
|
9 |
PUC |
29/03/2000 - 30/03/2000 |
Las Cruces - El Quisco |
|
10 |
PUC |
25/04/2000 |
Las Cruces |
|
11 |
PUC |
18/05/2000 - 19/05/2000 |
Las Cruces - El Quisco |
|
12 |
PUC |
06/07/2000 - 07/07/2000 |
Las Cruces - El Quisco |
|
13 |
PUC |
01/09/2000 |
Las Cruces |
|
14 |
PUC |
02/12/2000 |
Las Cruces |
|
|
|
|
|
|
15 |
Loco 1 |
09/09/1999 |
Las Cruces |
|
16 |
Loco 2 |
05/11/1999 |
El Quisco |
|
17 |
Loco 3 |
26/11/2000 |
El Quisco |
|
18 |
Loco 4 |
07/10/2000 |
El Quisco |
|
|
|
|
|
|
19 |
Quisco noche 1 |
23/09/1999 |
El Quisco |
|
20 |
Quisco noche 2 |
14/10/1999 |
El Quisco |
|
21 |
Quisco noche 3 |
09/12/1999 |
El Quisco |
|
22 |
Quisco noche 4 |
30/06/2001 |
El Quisco |
|
|
|
|
|
|
23 |
Quisco día-noche 1 |
10/12/1999 |
El Quisco |
|
24 |
Quisco día-noche 2 |
24/10/2000 |
El Quisco |
|
25 |
Quisco día-noche 3 |
12/11/2000 |
El Quisco |
|
|
|
|
|
|
26 |
Calentamiento diario 1 |
15/04/2000 |
Las Cruces |
|
27 |
Calentamiento diario 2 |
12/05/2000 |
Las Cruces |
|
28 |
Calentamiento diario 3 |
05/12/2000 |
Las Cruces |
|
|
|
|
|
|
29 |
Maipo 1 |
08/03/2001 |
Santo Domingo-Las Cruces |
|
30 |
Maipo 2 |
29/01/2003 |
Santo Domingo-Las Cruces |
|
31 |
Maipo 3 |
26/06/2003 |
Santo Domingo-Las Cruces |
|
32 |
Maipo 4 |
05/11/2003 |
Santo Domingo-Las Cruces |
|
|
|
|
|
|
33 |
Valpo 1 |
16/02/2002 |
Las Cruces |
|
34 |
Valpo 2 |
03/05/2002 |
Las Cruces |
|
Starting date |
Ending date |
CTD Model |
|
|
|
|
|
07/Nov/01 |
15/Nov/01 |
2745 |
|
15/Nov/01 |
23/Nov/01 |
2745 |
|
23/Nov/01 |
29/Nov/01 |
2745 |
|
29/Nov/01 |
07/Dic/01 |
2745 |
|
07/Dic/01 |
15/Dic/01 |
2746 |
|
15/Dic/01 |
26/Dic/01 |
2746 |
|
27/Dic/01 |
07/Ene/02 |
2746 |
|
07/Ene/02 |
14/Ene/02 |
2746 |
|
14/Ene/02 |
18/Ene/02 |
2745 |
|
18/Ene/02 |
22/Ene/02 |
2745 |
|
22/Ene/02 |
29/Ene/02 |
2745 |
|
29/Ene/02 |
06/Feb/02 |
2745 |
|
06/Feb/02 |
15/Feb/02 |
2745 |
|
15/Feb/02 |
26/Feb/02 |
2745 |
From November 2001 to January 2003 we registered hourly temperature, salinity, oxygen and fluorescence with a CTD moored in Las Cruces, every week the CTD was took out for mantention. In certain period were switched between 2 CTD, indicated by CTD Model in the table bellow.
Oceanographic Database